
Multi-Object Tracking (MOT) is an important but intractable problem in tracking scenes using sensors like radar, lidar, camera, etc. MOT is usually the prerequisite for subsequent collision avoidance modules in autonomous driving or sailing. Correct collision avoidance will be impossible if the target is lost or wrongly tracked.
The biggest challenge now to an effective and efficient MOT is the Data Association (DA). One explanation of DA is determining the source of the data you get. These measurements can be from natural or wrong targets (false alarms). Besides, for a real target, the detector may get errors at some point and fail to detect the target. A simple data association scenario is as follows: Suppose there is a ship (or a vehicle) and a detector (a camera + image recognition, or radar, lidar, etc.). Then, target tracking, as shown below:
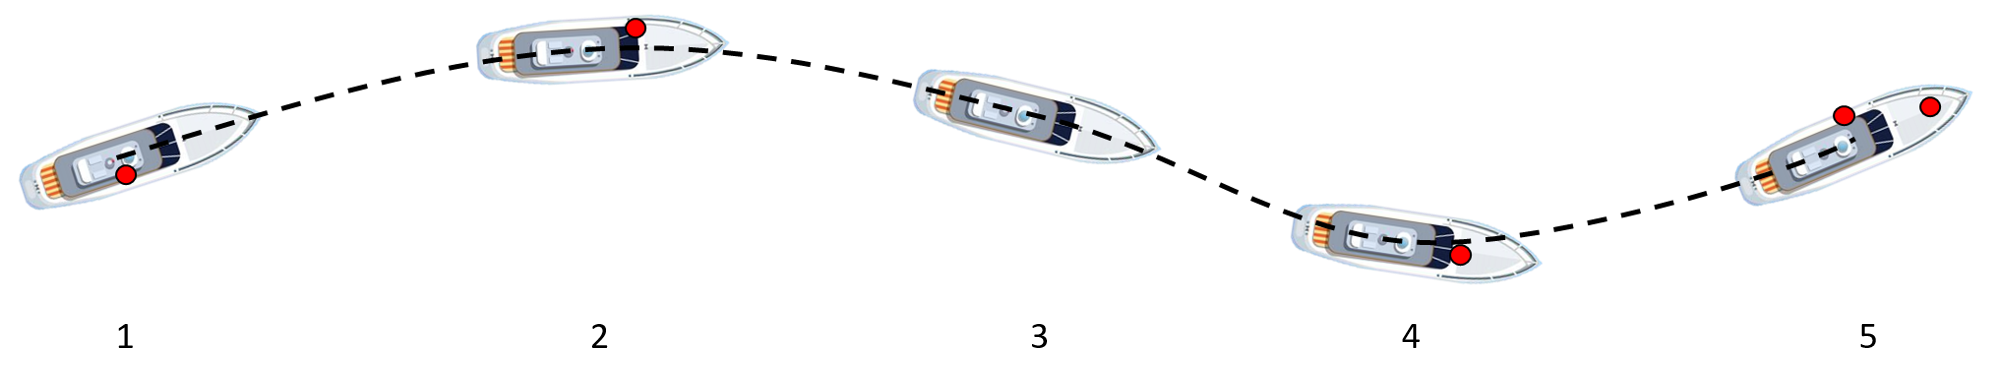
The dotted line denotes the trajectory of the ship’s actual movment. At moments 1-5, the ship figure represents its true state, and a red dot represents the detection result. There are two special moments: Moment 3, the ship still exists but the detector does not detect it (no measurements); Moment 5, two measures are returned. Assuming that each target generates at most one detection result at one moment, one of the measurements at the moment 5 must be wrong.
Let’s have a further look: For moment 5, we want to know if there is a correct measurement and which one is correct. To achieve this, we first establish a target matrix: [ O_5 ], and the measurement matrix: [d, e]. For this case, all the possibilities can be listed as follows:
- d is right
- e is right
- Both d and e are right
- Both d and e are wrong
Because of the previous assumption, we do not consider the third situation. The remaining three are all possible with different likelihoods. Then the question is how to evaluate these likelihoods? So, that is the first function of the DA algorithm to provide a way to assess this likelihood. The simplest is the nearest neighbor (NN). As the name implies, the closer the detection measurement is to the predicted state, the greater the probability is. Then we pick the result with the highest performance. Besides, Probabilistic Data Association (PDA) is another classic method. Instead of only considering the distance, all the measurements are denoted as a Gaussian distribution. The probabilities can be obtained by probabilistic density. With such evaluation methods, what we have to do is just to calculate all the probabilities and pick up the best one. Sounds not that difficult, right? Let’s look at a multi-target scenario.
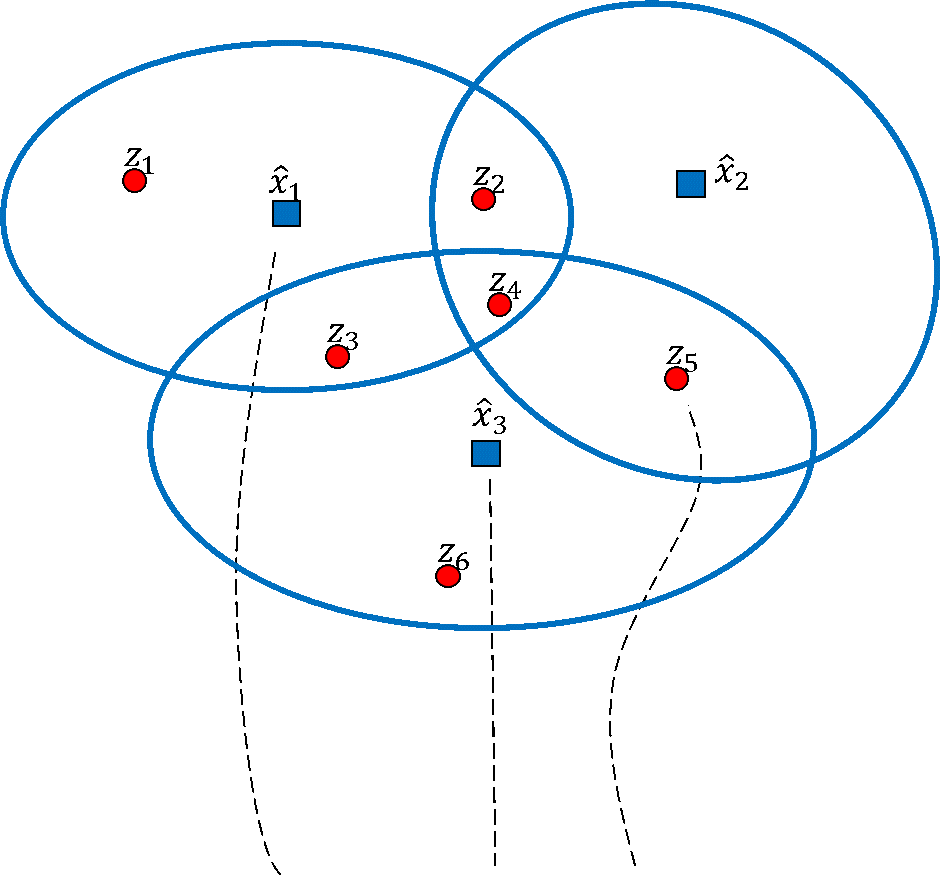
Wherein, x1 x2, x3 are the three predicted moment target positions (or the assumed true state), z1 to z6 are the measurement results. The blue circle in the figure is a simple gate used to filter out some data that is too far away. If you still try to use the NN method, you will notice that there are possibilities that multiple targets match the same measurement when some measurements are the closest to multiple targets. What should we do then? The Global Nearest Neighbor (GNN) is proposed by taking advantage of the trend to calculate all possible association situations and select the association with the shortest total distance or highest total probability. Essentially, determining all the association situations is a mathematical combination problem. We have to associate two matrixes [Object] and [measureents]. The number of association situations, in this case, is 229 ( ).
).
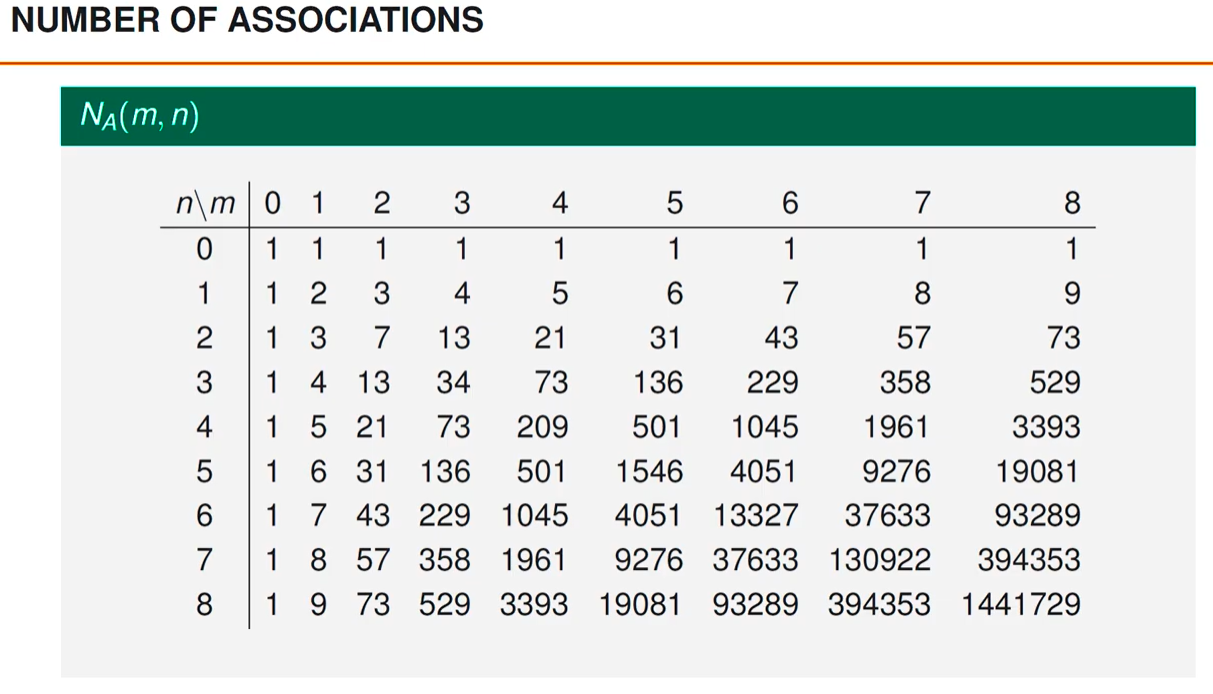
Compared to the first single-target case, the number of calculations has increased significantly, and consequently the calculation time has been longer. The number of calculations is explosive growth. The following table shows this number when the number of targets (n) and the number of detections (m) are between 0 and 8. It can be seen that when there are eight targets and eight detections, the number of possibilities for data association at a single time exceeds one million.
The actual scenarios can be more complicated.

When the time sequence is considered to associate targets in different frames, the number will increase exponentially (e.g., 229 x 229 x 229 …). In complex scenarios, it is contradictory that we require the autonomous system to react faster to ensure safety while the large computation volume much limits the computation time. That is why data association becomes the most significant bottleneck of MOT. Different methods will be introduced in the next blog to lower the computation time.
About the Author: Tianlei Miao
 Tianlei has studied in Naval Architecture and Ocean Engineering at Zhejiang University, where he graduated with his bachelor’s degree in 2017. During his bachelor’s years, Tianlei was awarded several scholarships such as National Scholarship in China and has held different leadership positions, such as President of the Student Union of Ocean College at Zhejiang University. He also spent 6 months at the Technical University of Munich in Mechanical Engineering.
In 2017, Tianlei started a dual M.Sc in Maritime Engineering at both Norwegian University of Science and Technology (NTNU), Norway, and the Royal Institute of Technology (KTH), Sweden. As part of the master’s program, he focused on the generation of the full-envelope hydrodynamic database of hydrostatic AUVs under the supervision of Prof. Dr. Ivan Stenius and Prof.Dr. Marilena Greco.
![]()